Search Results for "om price analysis"

Litecoin Price Analysis Indicates LTC Will Surge Over $200
The Litecoin community grows more excited as LTC surges towards its all-time high of $360.Our technical analysis indicates bullish price movements to come for the altcoin.
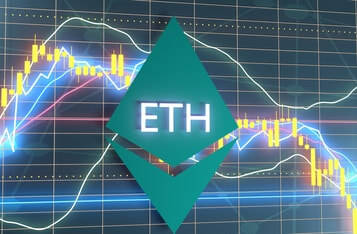
Ethereum Price Could Fall to $1,750 Over Next Three Days
After failing to hold above $1,900, our price analysis indicates ETH could continue trending downwards over the next three days.
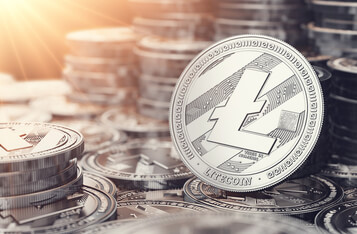
Litecoin (LTC) Price Analysis – March 18, 2021
The price of Litecoin (LTC) successfully rebounded above $200, but it seems that it is currently suffering from strong selling pressure.

BTC Price Analysis as Whale Alerts Indicate More Institutions Buying Bitcoin
As Bitcoin soared to a new all-time high of $57,808, over a billion dollars’ worth of BTC has left Coinbase to unknown wallets. What can we expect from the BTC price?

Chainlink Rises 50% in a Week, LINK Price Rally Set to Break ATH
Chainlink is finally joining the crypto price rally after LINK’s price broke above $16, with our technical analysis indicating there is plenty of room for a rally passed $20 and its ATH.

ETH and XRP Price Analysis: November 25, 2020
Following an impressive week-long growth, ETH and XRP are now slowing their paces. This piece explores the TA behind the current price dip.

February 18, 2021: Crypto Price Analysis for BTC, ETH, and DOT
As BlackRock has announced its intent to "dabble in Bitcoin", the cryptocurrency has continued its surge, along with Ethereum (ETH) and Polkadot (DOT).

Uniswap (UNI) Price Analysis-March 19,2021
UNI is trading at $30.55, but it appears to be caught on a bearish trend. Currently, the bears are retesting the support level of $29.27.

XRP Price Analysis: Why The Bulls Are Not Buying The Dip
As XRP continues its bearish plunges, more investors are shunning the cryptocurrency amid the SEC-fueled uncertainty.

Uniswap Price Analysis - March 5,2021
From the 4h candlestick chart of Uniswap(UNI), an inverse hammer pattern with a long upper shadow line was formed and UNI touched $31.56 temporarily. What is to be expected of UNI in the upcoming days?
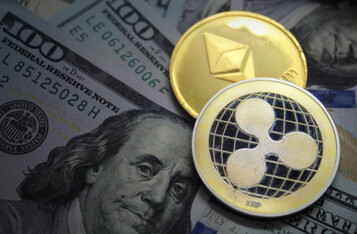
Ethereum (ETH) and Ripple (XRP) Price Analysis
Price analysis for Ethereum and XRP amidst the ongoing crypto rallies
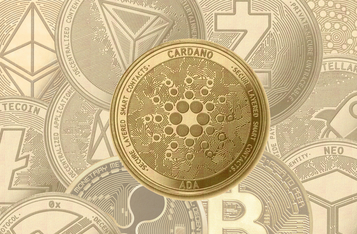
Cardano(ADA) Price Analysis – March 25,2021
With the fall of Bitcoin, Cardano (ADA), as the fifth-largest cryptocurrency with a market cap of $35,514,244,744, has also undergone a retracement.