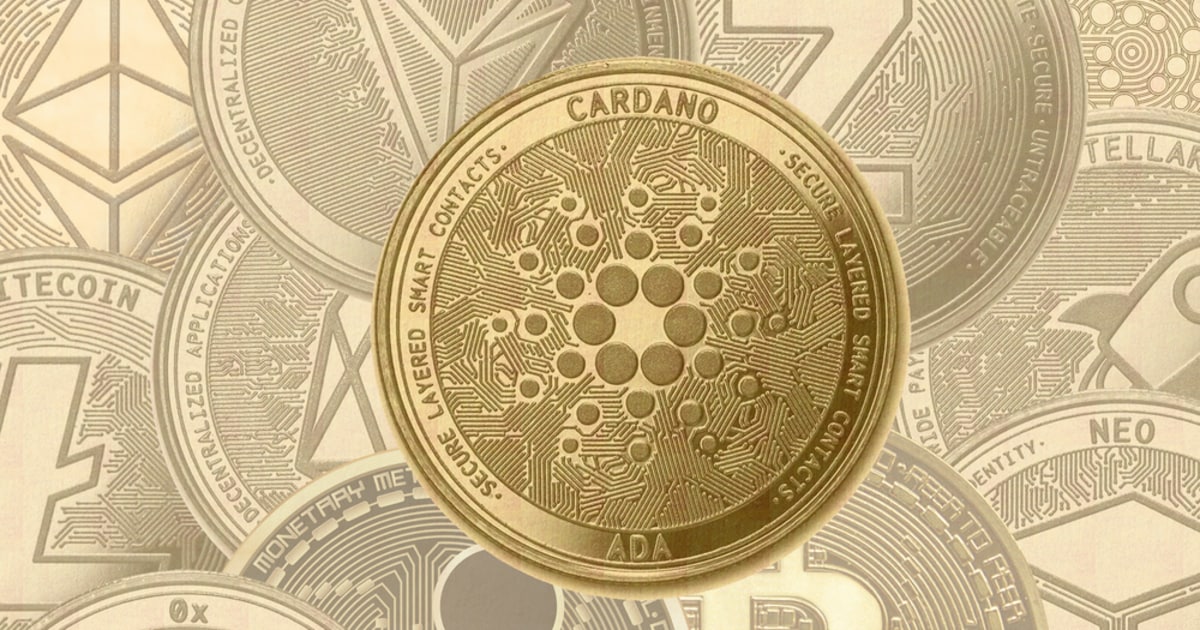
Cardano(ADA) Price Analysis – March 25,2021
With the fall of Bitcoin, Cardano (ADA), as the fifth-largest cryptocurrency with a market cap of $35,514,244,744, has also undergone a retracement.

With the fall of Bitcoin, Cardano, as the fifth-largest cryptocurrency with a market cap of $35,514,244,744, has also undergone a retracement.

Charles Hoskinson, the global CEO of Input-Output, tweeted that he had recorded his segments for the Cardano 360 event tomorrow.
Cardano 360 is led by Tim Harrison, the IOHK’s Marketing and Communications Director, and Aparna Jue, IOHK Product Director. This event aims to provide the latest news about the development of the Cardano ecosystem on a monthly basis.
In the comments section, Harrison also said that there will be some updates about Cardano's DeFi functions.
Cardano(ADA) Price Analysis
Source: ADA/USD Daily via TradingView
Since March 18, Cardano(ADA) has climbed to touch its previous all-time high(ATH) of $1.485. But currently, ADA has encountered strong selling. Since then, the altcoin has shown a downward trend on the price chart, and major corrective measures have been swept in. The current drawdown exceeds 20%.
At the time of writing, some restorations are underway to correspond to Bitcoin's own restoration. ADA is trading at $1.11.
Currently, the bulls are actively pushing prices to the 20-day Exponential Moving Average(20-EMA) of $1.14.
If the ADA/USD currency can push the price to $1.14 (20-EMA), it will begin to move towards the next resistance level of $1.485.
However, if ADA's price falls from the current level and breaks below the 50-EMA of $1.00, it may trigger further short selling. This may cause the price to fall to the next support level of approximately $0.815.
From the MACD chart, the blue MACD line has been hovering below the yellow Signal line and is still in a bearish trend. However, the stochastic RSI indicator has been stuck in the oversold zone, indicating that the blue K-line may surpass the yellow D-line and form a bullish crossover in the short-term.
Image source: Shutterstock


.jpg)
