
Ripple (XRP) Price Analysis - May 4,2021
Annie Li May 04, 2021 08:15
A number of significant events has led to XRP rebounding higher at the end of April. However, it may be difficult for XRP to maintain this momentum due to the weakening of the crypto market.

Although Ripple is still battling with the U.S Securities and Exchange Commission (SEC) to reach a conclusion on the outcome of XRP in the United States, the recent price action of XRP has been bullish. The surge in XRP's price can be allocated to several events that has served to positively influence XRP's price.

Phemex crypto exchange announced that it will relist XRP on its trading platform, as the cryptocurrency is in “great demand” on April 28. On the following day, Yoshitaka Kitao, the CEO of SBI Group, revealed that an initial public offering may be in Ripple's future plans.
However, due to the overall downturn in the cryptocurrency market, it may be difficult for XRP to maintain the above-mentioned upward momentum.
According to Coinmarketcap, Ripple is ranked as the fourth-largest cryptocurrency with a market cap of $67 billion.
Ripple (XRP) Price Analysis
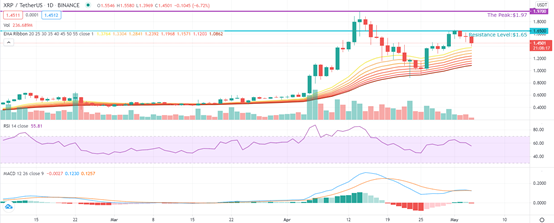
Source: XRP/USDT Daily via TradingView
Judging from the daily candlestick chart, yesterday, a bearish Doji pattern was formed on the chart, which implies that Ripple may soon reverse. Today, as Bitcoin has dropped 3.89% from its stable $58K level to the $55,795 level within 24 hours, the entire cryptocurrency market has fallen to varying degrees. Ripple (XRP) is no exception.
XRP dropped by 7.55% in 24 hours. At the time of writing, Ripple is trading at $1.46.
From the perspective of transaction volume, compared with the previous transaction volume, there are obvious signs of shrinking. It seems unlikely that there will be large fluctuations in the next trading day. This implies that bullish investors are still hesitant to buy in large quantities, but choose better timing and lower prices to buy on dips.
Currently, the price of Ripple is still running above the Exponential Moving Average ribbon. However, the Relative Strength Index indicator, which is developing downward and gradually approaching the equilibrium point of the bulls and bears sides, will continue to weaken on time.
The bear side will push the price down to the 20 day-Exponential Moving Average (EMA), which may put the defensive line to the test in the next trading.
The blue K line of the MACD indicator is glued down with the yellow Signal line. This indicates that the bullish momentum is weakening.
If the bulls can actively defend the 20-EMA of $1.38 support, then Ripple (XRP) is still in an uptrend. A break below the 20-EMA of $1.38 may indicate the beginning of a deeper correction to the 50-EMA of $1.12.
Image source: Shutterstock.jpg)