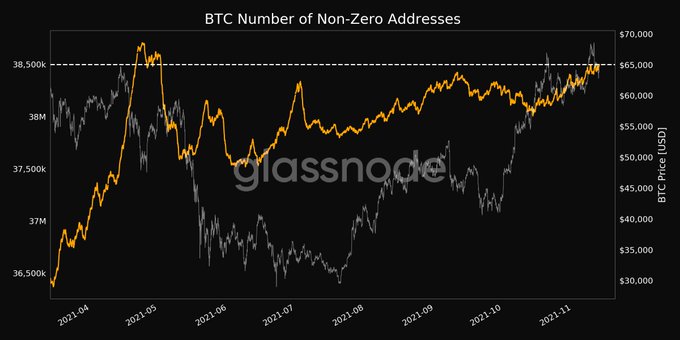
The No. of Non-Zero Bitcoin Addresses Hit a 6-Month High, amid Realized Volatility Drifting to a 1-year Low
Bitcoin has been attracting more participants, given that the number of non-zero BTC addresses reached a 6-month high.

Bitcoin (BTC) has experienced both twists and turns so far in 2021. For instance, the leading cryptocurrency was pushed to the wall in May after losing 50% of its value in a single day and dropped to lows of $30,000 as China intensified its crackdown on crypto mining.

Nevertheless, Bitcoin has been able to dust itself off by soaring the heights and recording historic highs of $69K this quarter. As a result, it has been attracting more participants, given that the number of non-zero BTC addresses reached a 6-month high of 38,498,609.
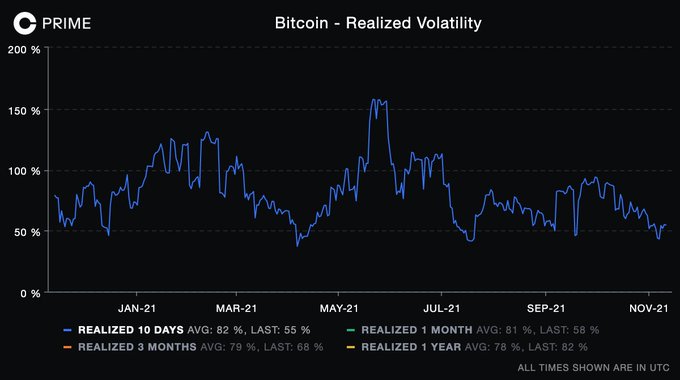
Bitcoin’s realized volatility drops to a one-year low
According to market insight provider Coinbase Institutional:
“Bitcoin realized volatility slowly drifting back towards a one-year low.”
This means volatility might come back soon, given that it’s at rock bottom. Based on these statistics, there is a high probability that Bitcoin will experience a leg up.
On the other hand, IntoTheBlock’s IOMAP indicator shows that a significant support wall stands between $61,300 and $63,160. Nevertheless, Bitcoin has to breach a supply barrier between $64,850 and $65,660 for an uptrend to resume.
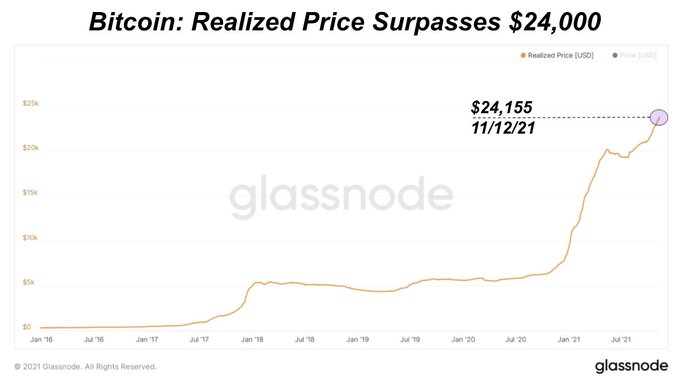
Bitcoin’s realized price surges past $24,000
Bitcoin’s realized price has been going through the roof because it recently hit $24,000.
This metric shows Bitcoin’s on-chain cost basis because it depicts the average price that every coin was moved on the network.
Therefore, realized price does not calculate coins that remain unmoved because cryptocurrencies can be lost, unclaimed or unreachable.
Meanwhile, Bitcoin’s holding culture continues to gain steam based on BTC exiting exchanges.
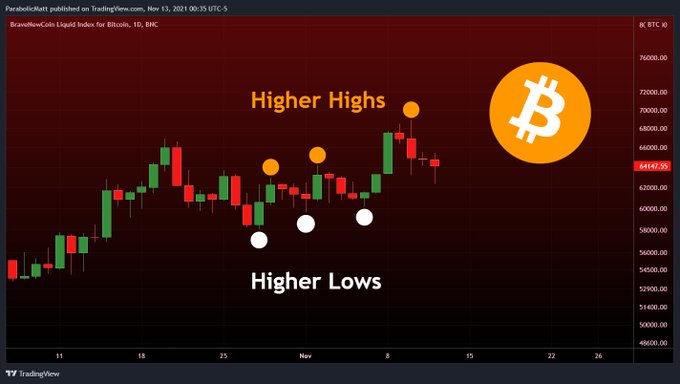
With Bitcoin having created higher highs and higher lows since bottoming at $58,000 on October 28, whether an upward momentum will be regained remains to be seen.
Higher highs and higher lows signify an uptrend, whereas lower highs and lower lows show a downtrend.
Image source: Shutterstock


.jpg)
