Is Bitcoin Market Sentiment Shifting from Fear to Capitulation?
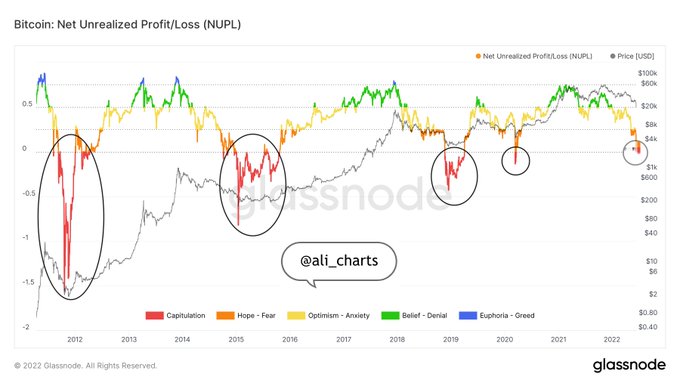
As Bitcoin (BTC) continues hovering around the $20K zone, market sentiment might be changing from fear to capitulation.

As Bitcoin (BTC) continues hovering around the $20K zone, market sentiment might be changing from fear to capitulation.

“Bitcoin goes from $69,000 to $17,600, and people are still looking for signs of capitulation? There can be another downswing to $16,000-$14,000, but be aware that you will never time the BTC bottom. DCA all the way,” Market analyst Ali Martinez explained.
Bitcoin slipped to lows of $17K over the weekend, but it has been able to reclaim the $20K level. The leading cryptocurrency was hovering around $20,203 during intraday trading, according to CoinMarketCap.
Martinez had previously noted:
“The market sentiment around Bitcoin appears to have shifted from “Fear” to “Capitulation.” This represents the last stage of a bearish cycle before the market sentiment shifts into “Hope” to signal the beginning of a new bull market.”
Source: Glassnode
Capitulation in the market happens when investors have given up on trying to recover lost gains based on falling prices. As a result, analysts believe that it signifies a market bottom.
On the other hand, Bitcoin needs to stay above the significant support zone of $20K because this will increase its chances of building momentum. Martinez noted:
“Over 400K addresses bought 516K BTC at $19,200, which should serve as support. Still, transaction history also shows that 700K addresses had previously purchased 520K BTC between $20,300 and $21,500. These are the most important support and resistance areas you should pay attention to.”
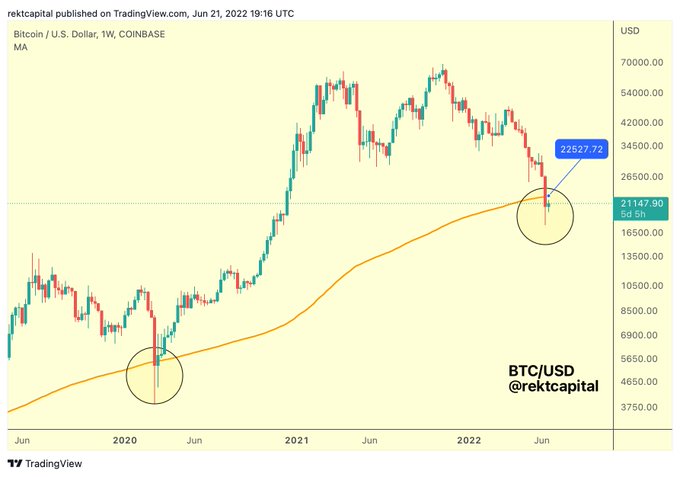
Meanwhile, Bitcoin needs to break above $22,500 to reclaim the 200-week moving average (MA) as support, says crypto analyst Rekt Capital.
Source: TradingView/RektCapital
The 200-week MA reflects a long-term measure that shows four years of an asset’s price action. Previously, it acted as the last shield during BTC bear cycles.
Image source: Shutterstock


.jpg)
