Bitcoin (BTC) Price Analysis – March 15,2021
Bitcoin (BTC) performed strongly in the past week, breaking through the previous high of $58,354. Bitcoin continued to rise, soaring to a new all-time high (ATH)of $61,781 on March 13. But it seems that Bitcoin has suffered strong selling interest near this level and the price has been corrected. At the time of writing, Bitcoin is trading at $60,157.82.

Bitcoin has tripled in value over the last three months and has risen by more than 1,000% in the past year, surging higher due to the increasing demand of hedges against inflation and plenty of speculative opportunities by institutions and companies.

Bitcoin Price Analysis
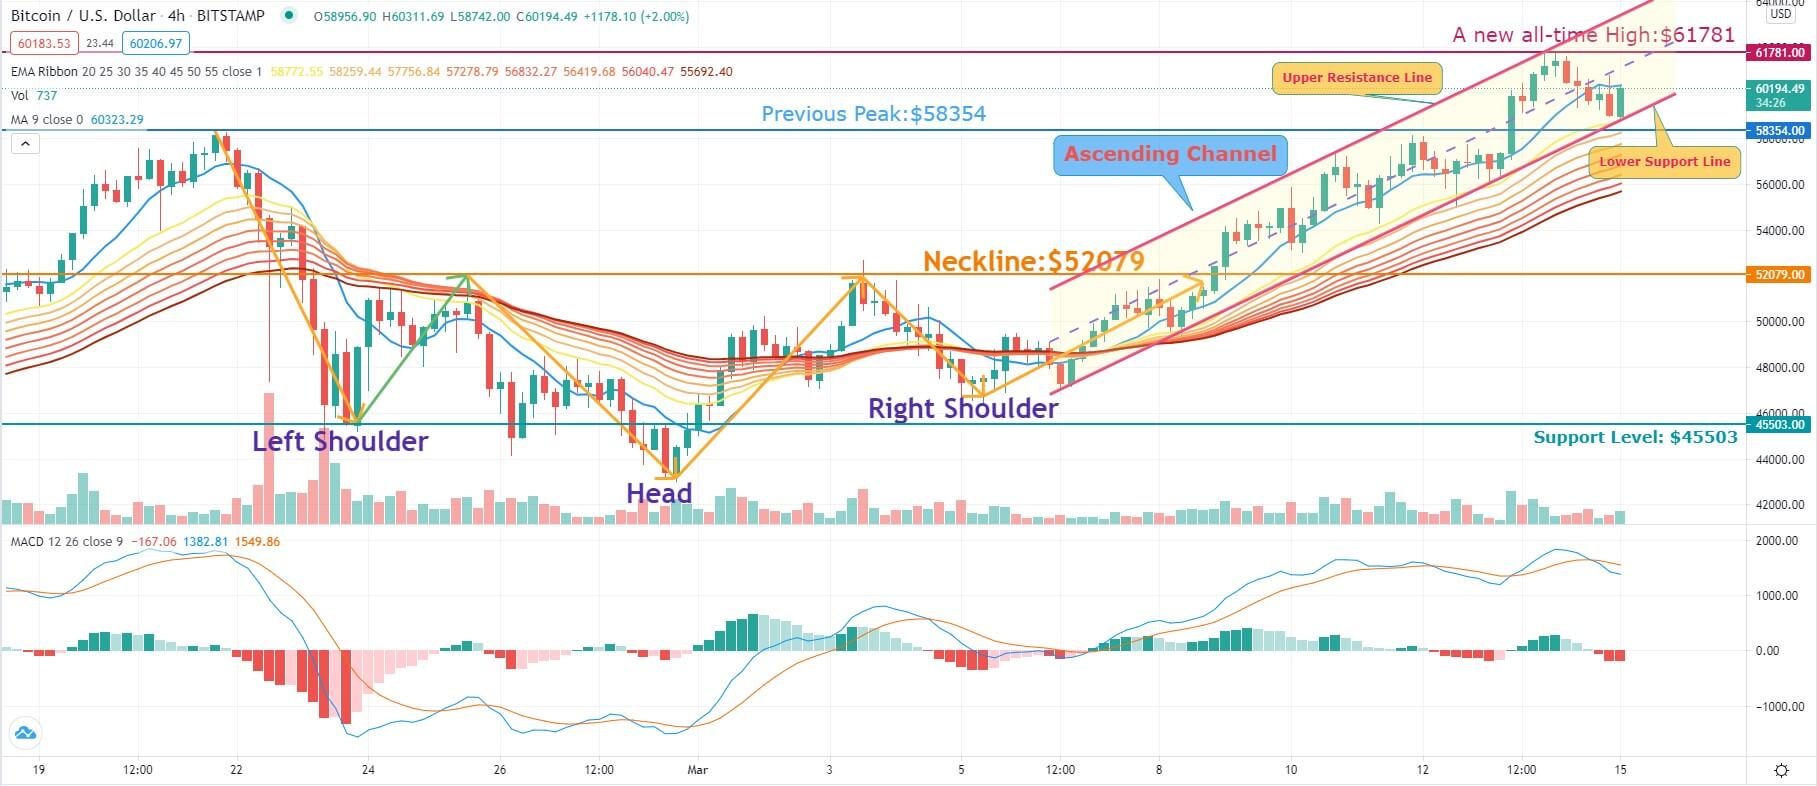
Source: BTC/USD 4-Hour via TradingView
Bitcoin (BTC) performed strongly in the past week, breaking through the previous high of $58,354. Bitcoin continued to rise, soaring to a new all-time high (ATH) of $61,781 on March 13. But it seems that Bitcoin has suffered strong selling interest near this level and the price has been corrected. At the time of writing, Bitcoin is trading at $60,157.82.
At present, BTC has formed an ascending channel and fluctuates in the channel. The rising moving average indicates that it is still bullish momentum in the short term. Bitcoin is currently testing the effectiveness of the lower support line of the rising channel.
The 4-hour candlesticks chart shows that the bulls have repeatedly tested the 20 day-Exponential Moving Average(20-EMA) support. Therefore, the bulls may try to defend the 20-EMA again. If the price falls out of the ascending channel as well as falling below the 20-EMA support level, it indicates that the short-term trend may change. The next support level is the 50-day exponential moving average of around $56,000. A break below this support level will indicate that a break of $58,341 may be a bull trap. Any more losses may open the door to the neckline position of the previously inverted shoulders and head pattern, which is approximately $52,000.
On the contrary, if it proves to be effective and BTC shows positive signs, then the support line below the ascending channel will be an important short-term bullish support line. The first resistance level will be the midline position of the channel at approximately $61,000. If it can continue to stand on the 9-day Moving Average line, then BTC/USD is highly likely to break through its all-time high of $61,781.
A break of this resistance level may indicate the beginning of the next phase of an uptrend. The next target position for the bulls will push BTC up to $65,000. Any further increase may push the price to the psychological mark of $70,000 in the short term.
Image source: Shutterstock